Leaching and percolation tests
Leaching tests and percolation tests intend to mimic the natural or man-made conditions where waste or materials could be stored or used. The tests have therefore a tendency to be naturally different from one country to another, since the natural conditions (rain, evaporation, drainage, frost, storage conditions, etc.) and the uses they mimic are different.
Leaching tests are, from a chemical point of view, partial (mild) extractions and the result depends on strict compliance with the test conditions (particle size, leaching, duration, temperature, agitation, solid/liquid separation – decantation, centrifugation, frontal filtration, tangential filtration, filter pore size, tolerance of a filter cake, volume of leaching to be filtered, etc.) to obtain good (intra-laboratory) repeatability and (inter-laboratory) reproducibility (Hennebert et al. 2022).
The acceptable (meaningful) variability of analytical methods
A validated standardized analytical method must have a limited variability when analyzing test portions homogeneous (at their scale), to ensure consistency of results and comparability of data.
The variability of leaching and percolation tests is developed further in this page.
A leaching test is a succession of three operations: (i) sample preparation, (ii) leaching of the test portion, and (iii) quantification of elements, substances or parameters in the leachate.
The variability for a given leaching or percolation laboratory test should be under control.
The variabilities of standardized leaching tests are high compared to the variability of total extraction methods (Hennebert et al. 2022), and frequently exceeds what is significant for a normal distribution (95% of the data of repetitions included in the range [mean – 2 standard deviations ; mean + 2 standard deviations] (Figure 1).
As there are no negative concentrations, the lower limit of the confidence interval of any measurement should not be negative : (mu – 2 sigma) noted here (m – 2s) must be positive. This is equivalent to have s/m <= 0.50. For the 99% confidence interval (m-3s) must be positive and this is equivalent to have s/m <= 0.33.
The variability is conveniently expressed as the standard deviation relative to the mean s/m and so being the relative standard deviation (RSD also called coefficient of variation (CV). This ratio is unitless or can be expressed in percentage. It allows immediate comparison of variability of methods.
Figure 1 : The distribution of repeated measurements of a standardised analytical method is bell-shaped. As the minimal observed value cannot be lower than zero, to be « normally » distributed, the relative variability of 95% of the data must be lower than s/m = CV < 0.50 and the relative variability of 99% of the data must be lower than S/M = CV < 0.33). (Source Analystprep.com)
The variability of the EN 12457 series ((batch leaching test, 2 or 10 litres of deionised water/kg material grinded to 4 or 10 mm, shaking for 24 h, decanting, centrifugating if filtration is slow and filtrating with 0.45 µm membrane) is low for many parameters but too high for some. From the validation data, the inter-laboratory variability CVR exceeds in some cases 0.50 = 50%.
Figure 2: Variability of intra-laboratory analysis, intra-laboratory leaching and analysis CVr and inter-laboratory leaching and analysis CVR (source: validation data of EN 12457 series)
Variability of leaching test as a function of leachate concentration? No
The variability of analyses, repeatability (CVr) and reproducibility (CVR) of the validation data detailed in the annexes of the batch leaching test EN 12457-2 are presented in Figure 3 a, b and c as a function of parameter concentration (data > limit of quantification – LOQ).
Figure 3 a, b and c: CVr of analysis of leachate, CVr and CVR of (leaching and analysis of leachate) (validation data of EN-12457-2)
The 24-hour batch leaching tests are mainly used for landfill acceptance or allocation of inert waste in the EU. The average intra-laboratory CVr is 0.17 (n=38, different waste, element concentration > LOQ) and the average inter-laboratory CVR is 0.36 (idem).
There is no statistical relationship between the variability and the concentration.
Variability of the column percolation test of the waste EN 14405
A 30cm long time 5 or 10 cm diameter is percolated from the lower part (to avoid air pockets and preferential flow) with water with a residence time of about 24 h (depending on the porosity of the packed column). A L/S ratio of 10 l/kg s achieved in about 30 days.
The variability is lower:
| Method | Standard | CVR Mean | CVR Max |
| Batch 1 day residence time | EN 12457-2 | 0.36 | 1.1 |
| Column 1 day residence time | EN 14405 and EPA 1314 | 0.15 | 0.38 |
| Column 8 hours residence time | EN 16637-3 | 0.57 | 1.55 |
(all data from validation trials of the standards)
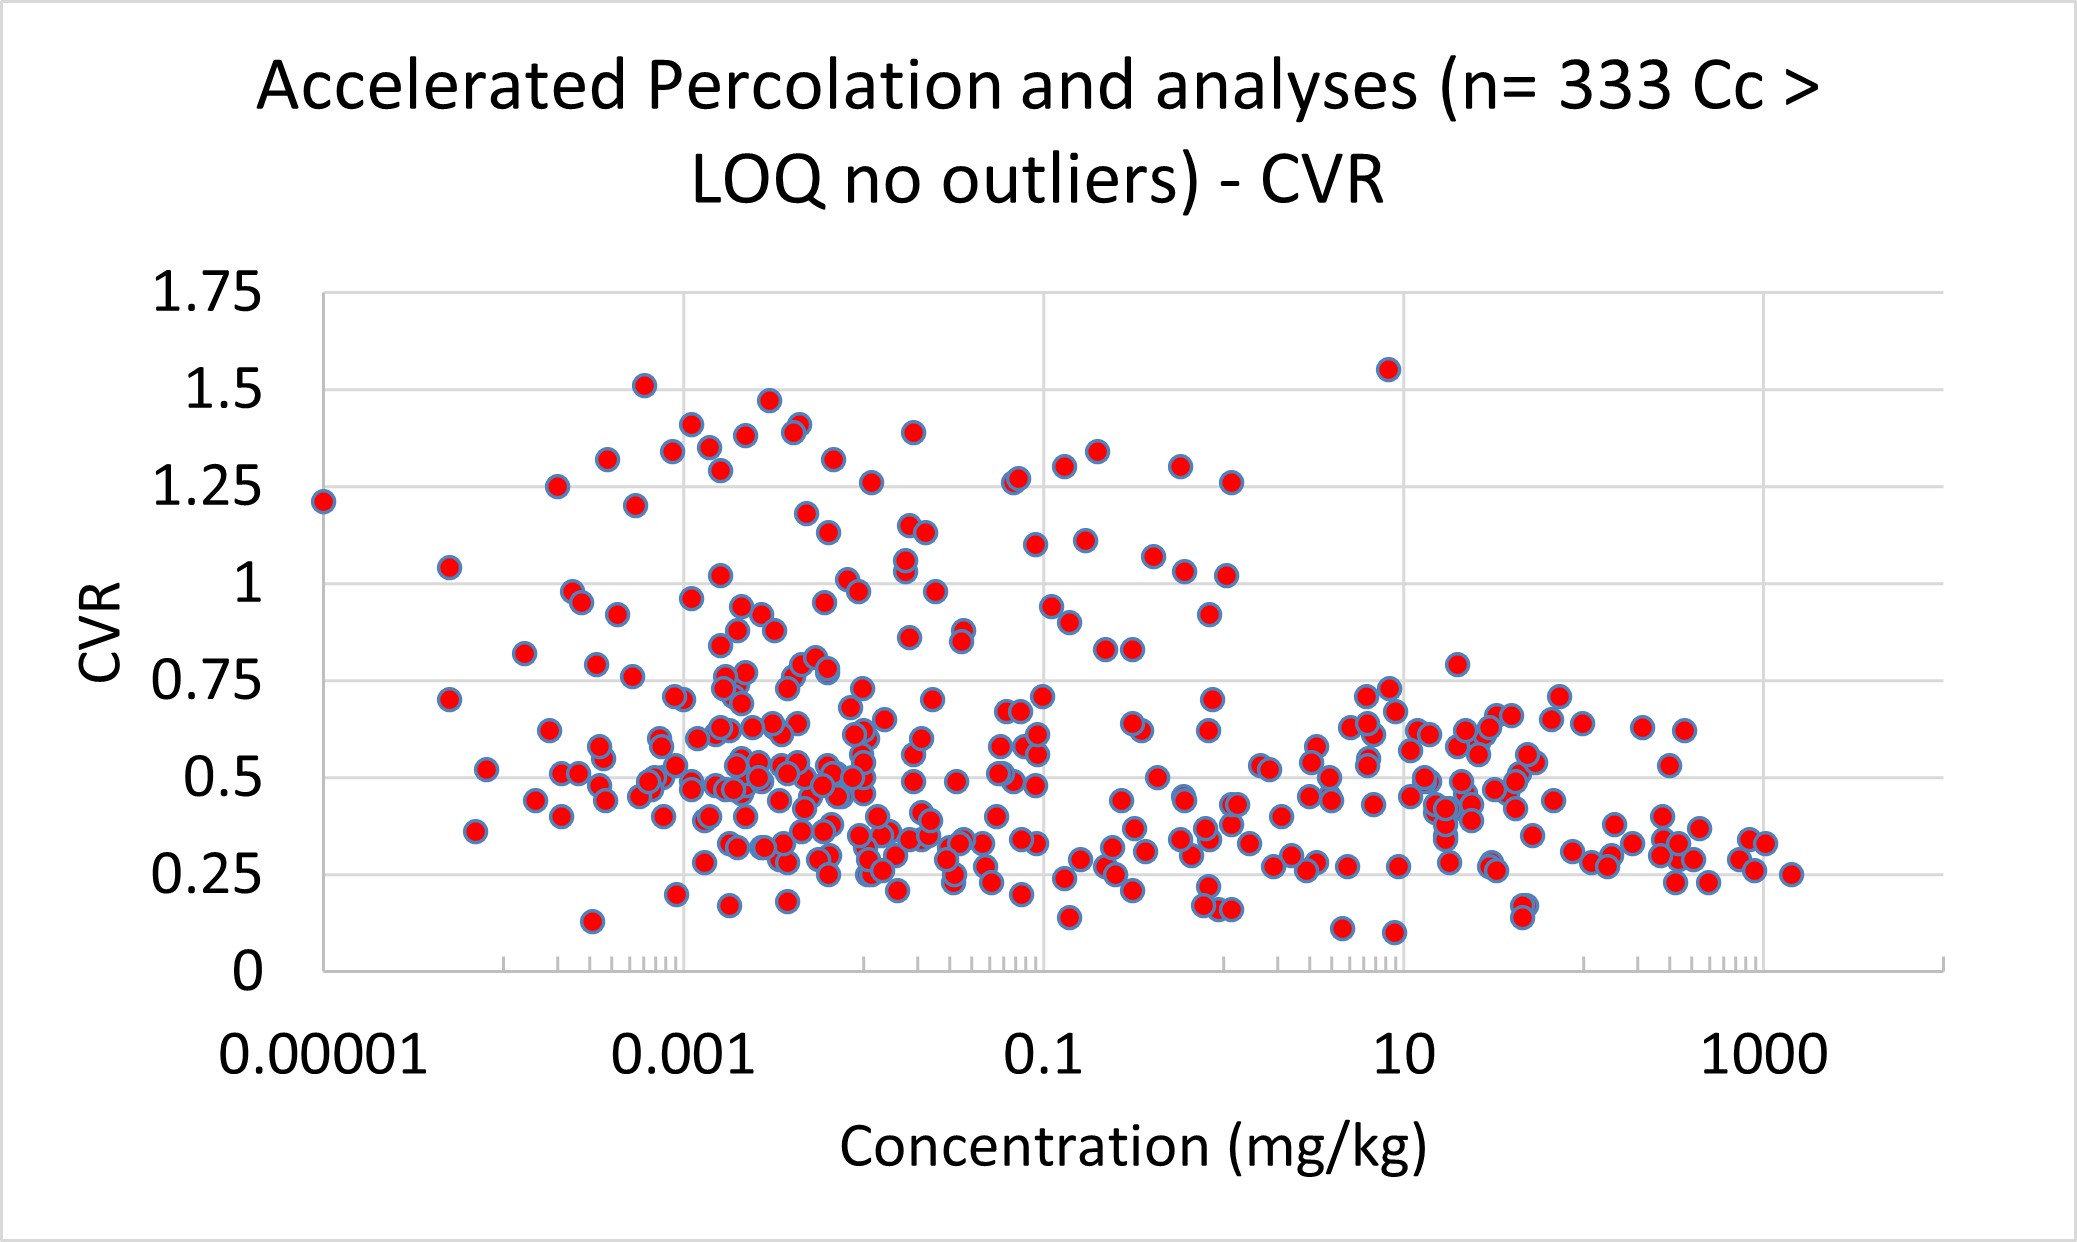
The excessive variability of the accelerated column percolation test of the construction and demolition materials EN 16637-3 makes it unusable
The situation is worse for the accelerated (8 hours residence time of water in the column rather than 24 hours in the batch leaching tests EN12457 and in the waste column test EN14405) and with low test portion mass related to grain size less of the accelerated percolation test EN 16637-3. That test is derived from the waste test EN 14405, but with a « compromise » of coarser material and lower residence time of the water in the column.
The intra-laboratory CVr and inter-laboratory CVR are presented as a function of concentration, of L/S ratio, and by sample (Figure 4 a, b, c ,d and e). The statistical analysis of variance indicates no influence of these three factors neither of parameters on CVr and CVR. The validation trials are not conclusive: the very high variability for all the elements (mean CVR = 0.57) and organic substances (mean CVR = 0.73), all waste and all percolation fractions indicate the simultaneous presence of low values and high values during repetitions, so that the results are not normally distributed (details in Supplementary Information of the cited paper, free access). The method cannot be used to assess leaching concentrations.
Figure 4 a, b, c, d and e: CVr and CVR of the accelerated percolation test of construction materials are high and not function of the concentration of the elements (upper figures), neither of the liquid-to-solid fraction (mid figures), nor of the sample (lower figure – three samples, for each sample left column CVr, right column CVR) (validation data of prEN 16637-3)
The mean CVR of the validation data of the 30-days column test EN14405 and the corresponding US column test method 3904 is 0.15 (maximum of 0.38), to be compared with 0.57 for the accelerated percolation test.
Ill-defined solid/liquid separation (leaching or percolation tests).
Experiments indicates that this last point is critical since there are colloids and nanoparticles in the leachates, representing from 0 to 100% of the element fraction in the leachate. Numerous authors have documented that point.
In the Supplementary Information of Hennebert et al. (2022) (above-mentioned reference) are presented:
- A limited literature (7 papers) review showing all the presence of nanoparticles in leachates. Much other papers could have been cited
- Experimental date with counts of particles < 0.45 µm in leachates (100 million per milliliter), and the fact that, counter-intuitively, the centrifugation before the 450 nm-filtration delivers leachates more concentrated in particles (1 sample) and statistically more concentrated in elements (+13%, 27 samples, 287 paired data) (Hennebert et al. 2022, supp info). Without centrifugation, a filter cake can build up on the membrane and act as additional filter for the particles. That point is discussed in detail in the EU leaching test ((annex E of EN 12457 series).
Discussion and Conclusion
The 8-hours residence time percolation test has a mean CVR of 0.57, while the 24-hours residence test EN14405 has a mean CVR of 0.15.
24-hours batch leaching test has a mean CVR of 0.36.
For end-of-waste criteria of materials in contact with the environment in the intended use, such as recovered aggregates, a method with 1 day solid/liquid contact time should be used. Many data have shown that the cumulated quantity of the percolation test up to 10 l/kg is equal to the quantity that is leached in the batch test with L/S = 10 l/kg.
As the variability of the quantification step (after extraction) is limited in waste and soil analyses to about 1% (intra-laboratory CVr = 0.01 = 1%), the variability of the tests stems from three main sources:
- non-homogeneous test portions (batch, column tests);
- variable extraction rate, due to presence of options in the method (batch test) or insufficient time for equilibrium (accelerated column test);
- ill-defined solid/liquid separation (batch and to a lower extent percolation tests).
Experts in standardization bodies of construction materials and waste from Germany, The Netherlands, Denmark and Finland of the CEN TC444 should stop to deny the variability of the tests, and accept strict modus operandi to reduce that variability, avoiding to jeopardise these methods of assessment of the mobile fraction of waste, useful for risk assessment and circular economy.
More data in the cited paper and its supplementary information:
Hennebert P, Stoffel A-F, Hubner M, Fortmann D, Merdy P, Beggio G. 2022. The inherent variability of some environmental analytical methods hampers the circular economy of materials. Detritus. 17 p. https://doi.org/10.31025/2611-4135/2022.16225
Also useful:
Beggio G, Hennebert P. 2022. A novel method to calculate the size of representative waste samples based on particles size. Detritus, 18, 3–11. https://doi.org/10.31025/2611-4135/2022.15187
Hennebert P, Beggio G. 2021. Sampling and sub-sampling of granular waste: size of a representative sample in terms of number of particles. Detritus 17 – 2021, 1-12. https://doi.org/10.31025/2611-4135/2021.15139
Contact: pierre.hennebert@gmail.com
https://www.researchgate.net/profile/Pierre-Hennebert
Environmental Chemist, Waste, Resources, Consultant in waste management and circular economy. Former convenor of the “leaching” and the “sampling” working group of the European Committee for Standardization CEN TC 444 “Analytical methods for the environmental characterization of soils, waste, bio-waste and sludge”.
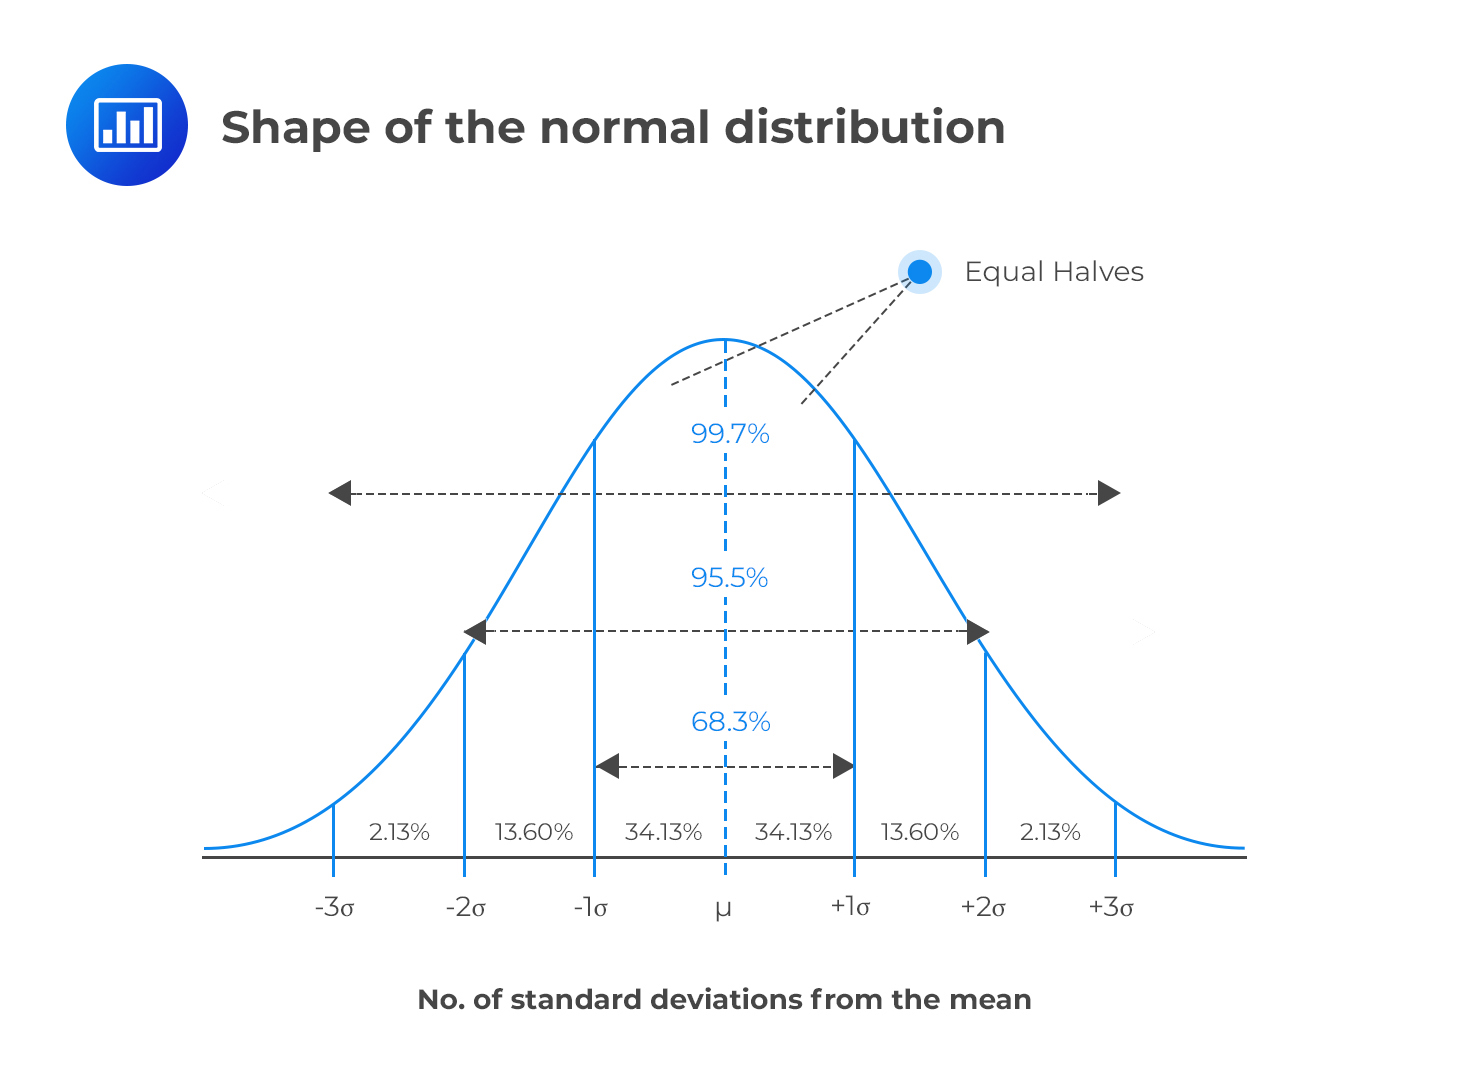
FIg 1 Normal distribution 2
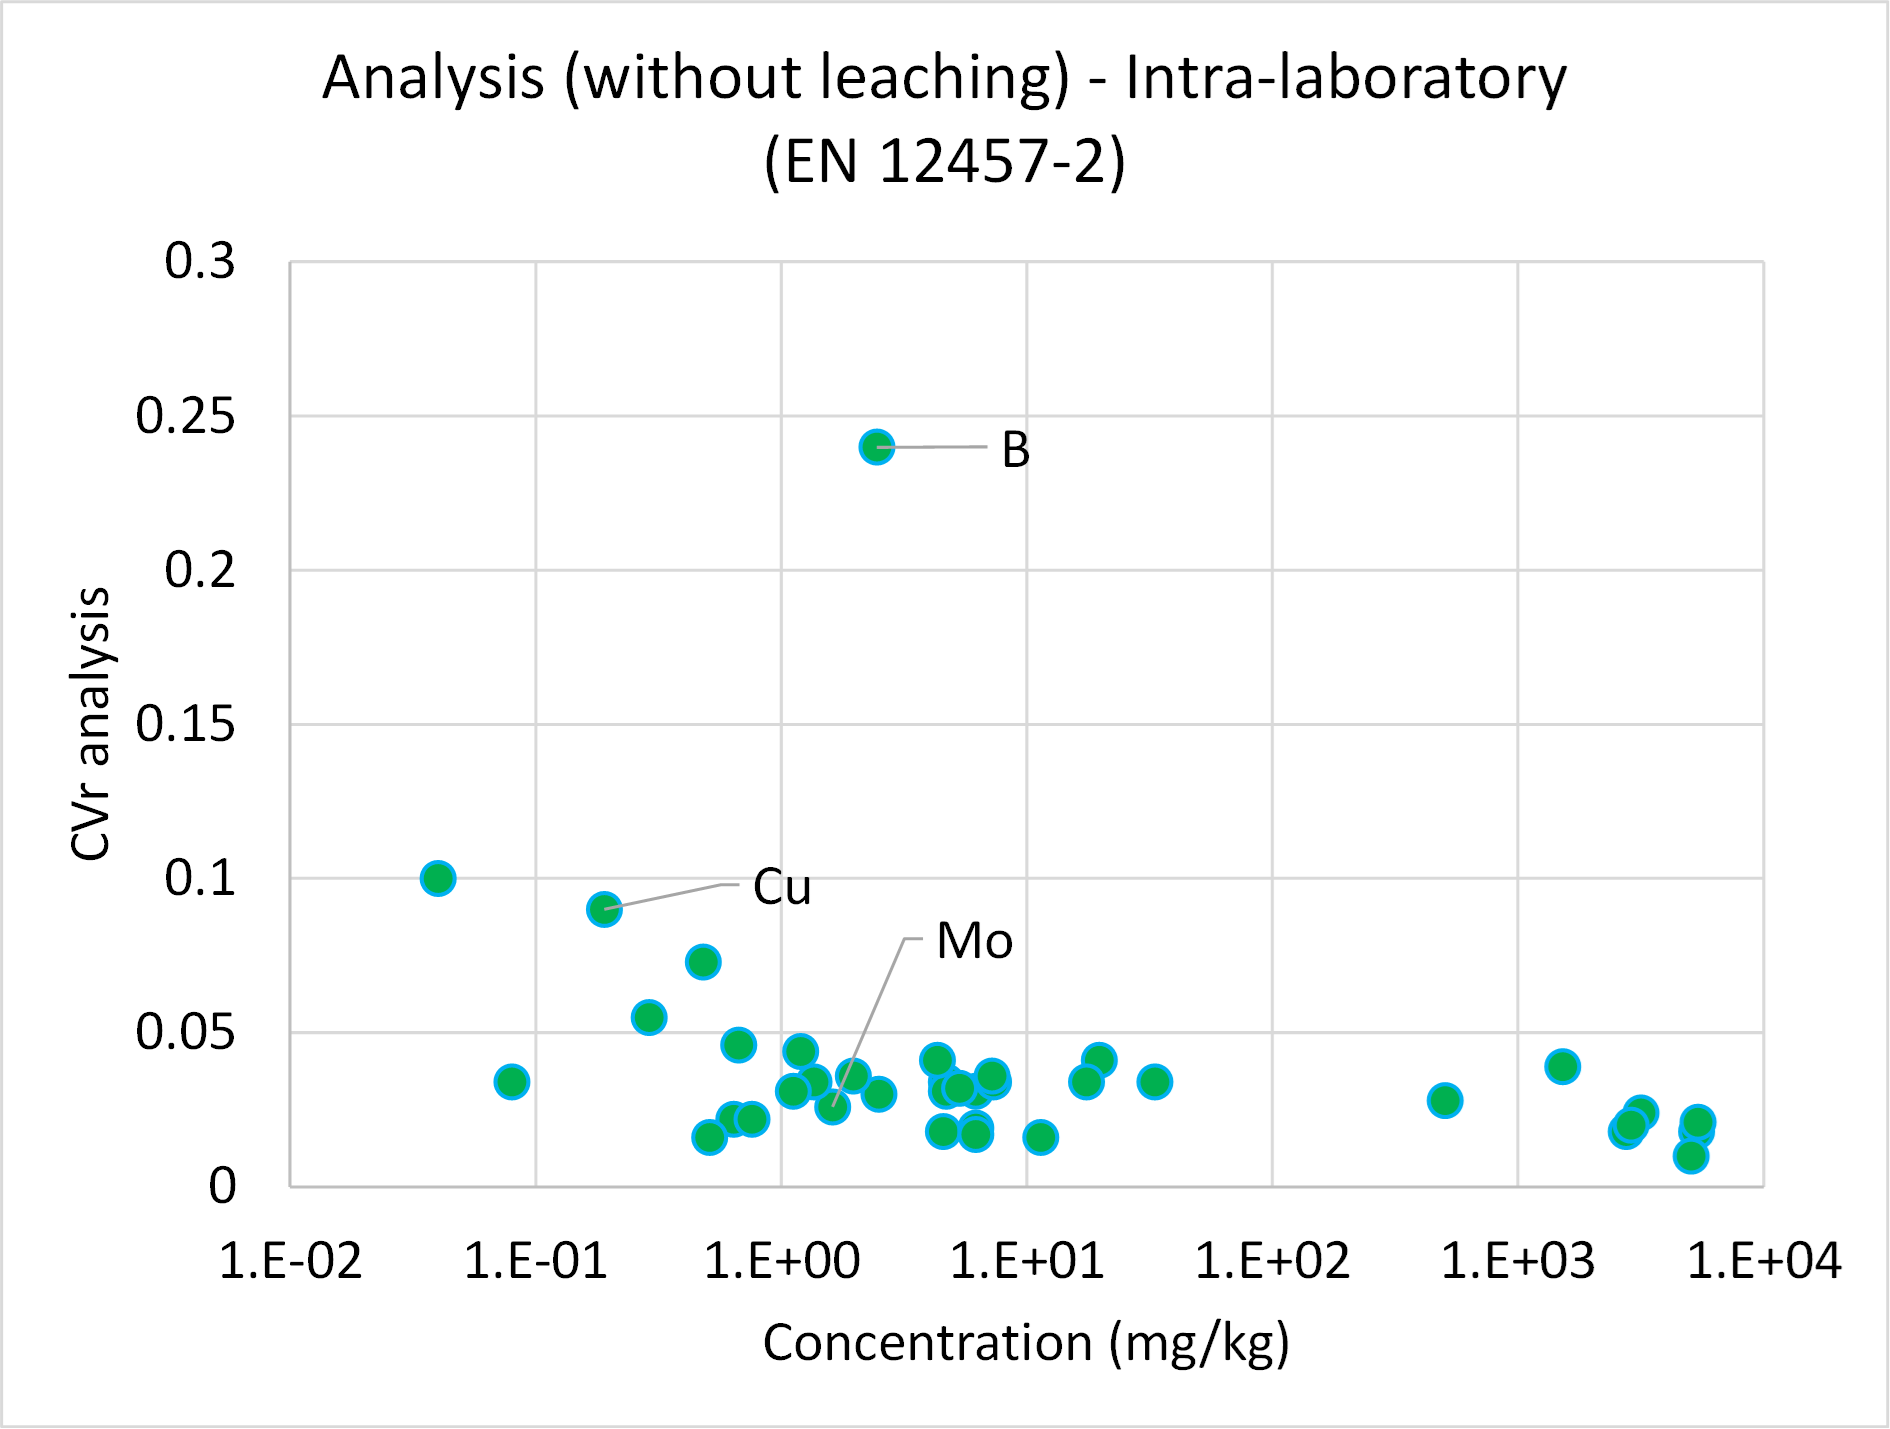
Fig3a Variability of leaching tests
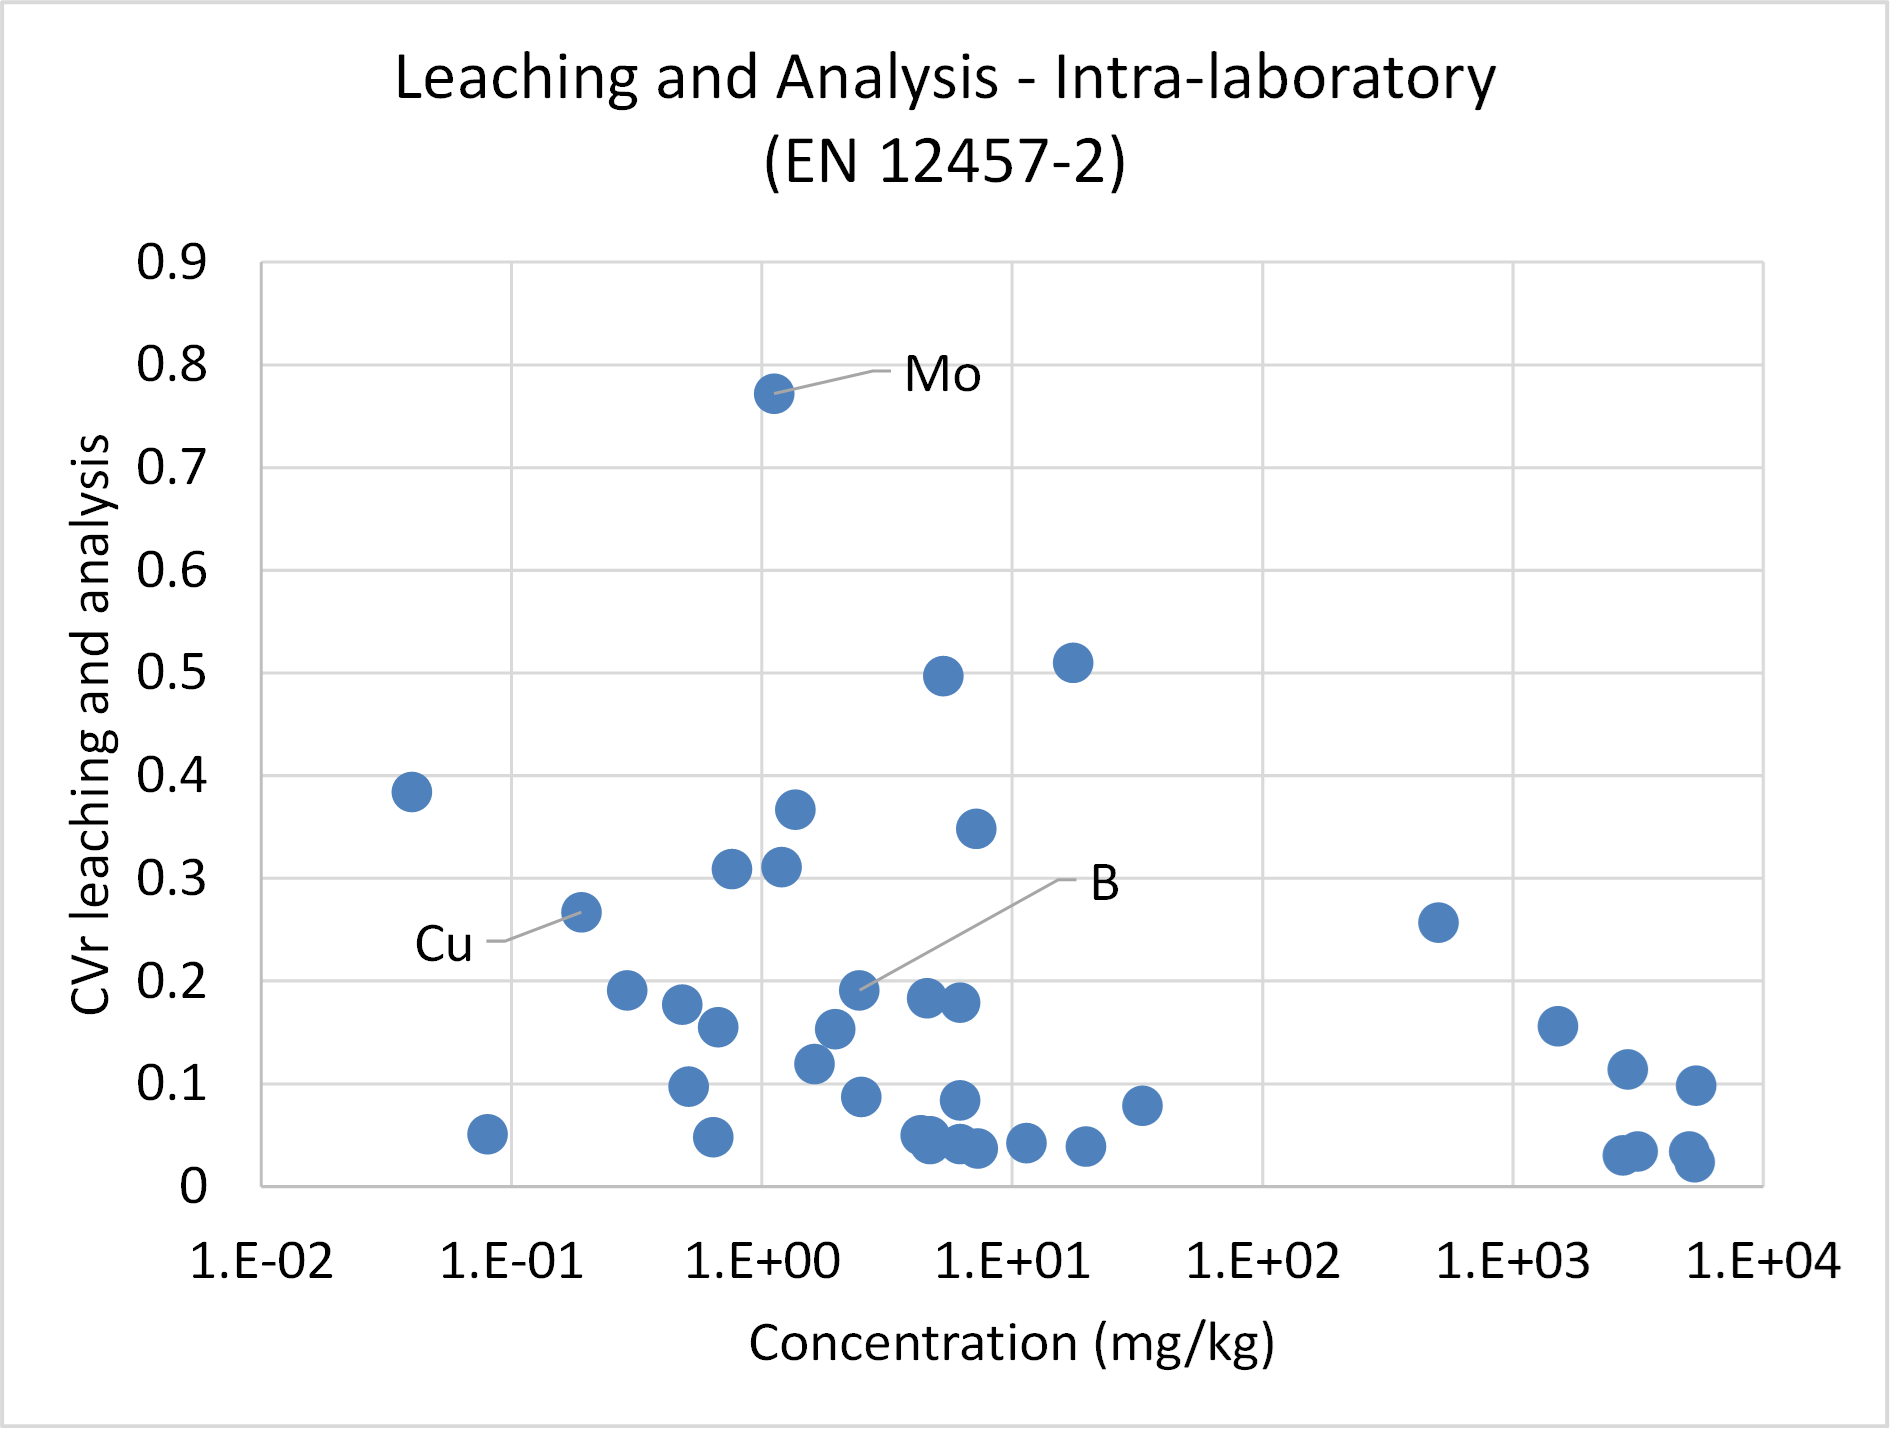
Fig3b Variability of leaching tests
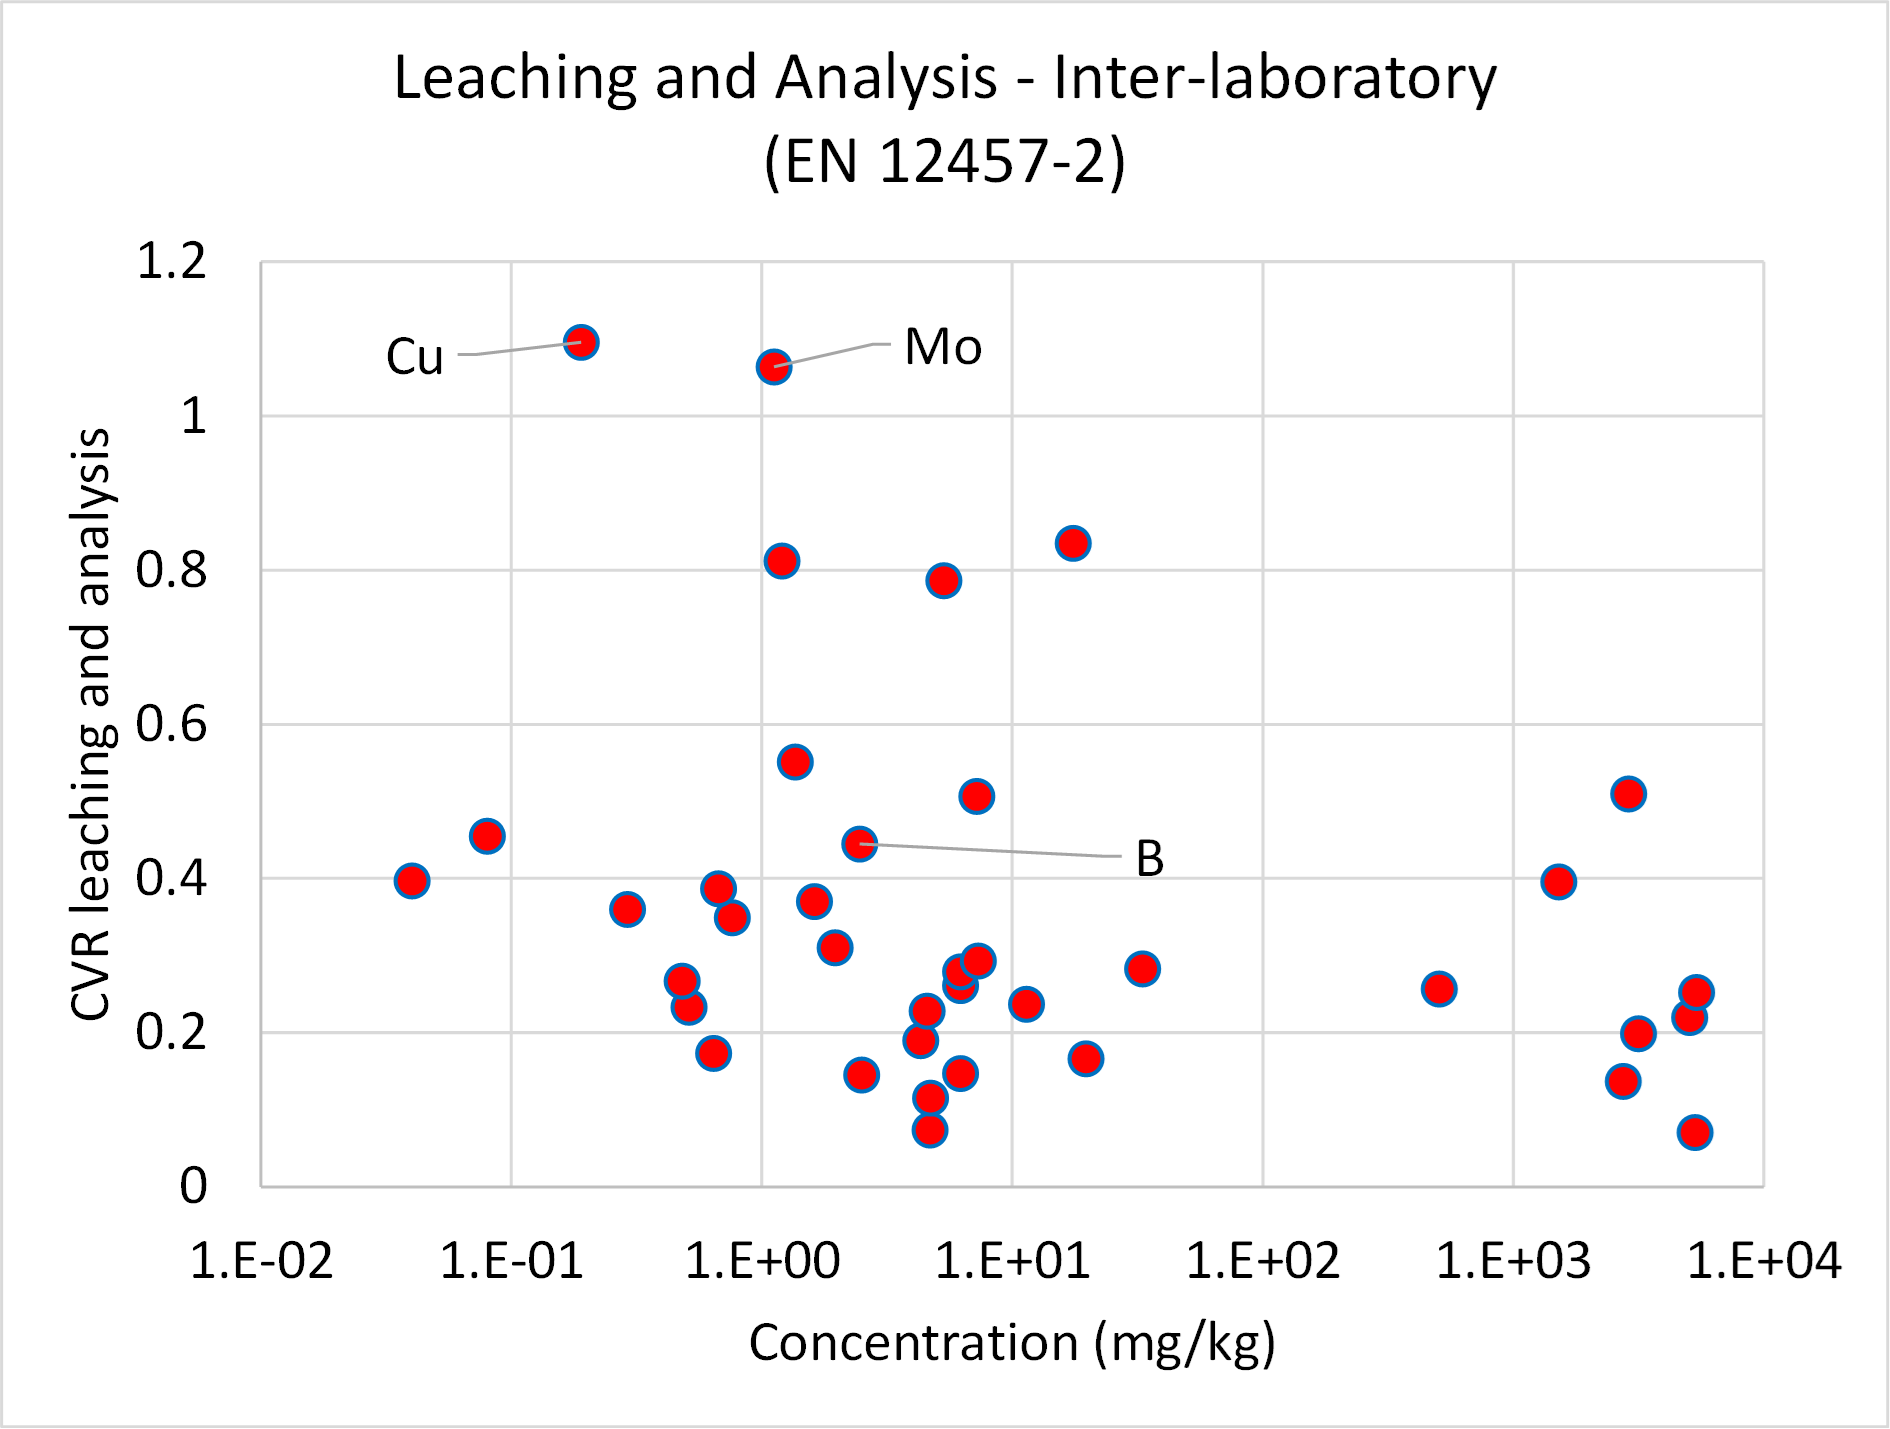
Fig3c Variability of leaching tests
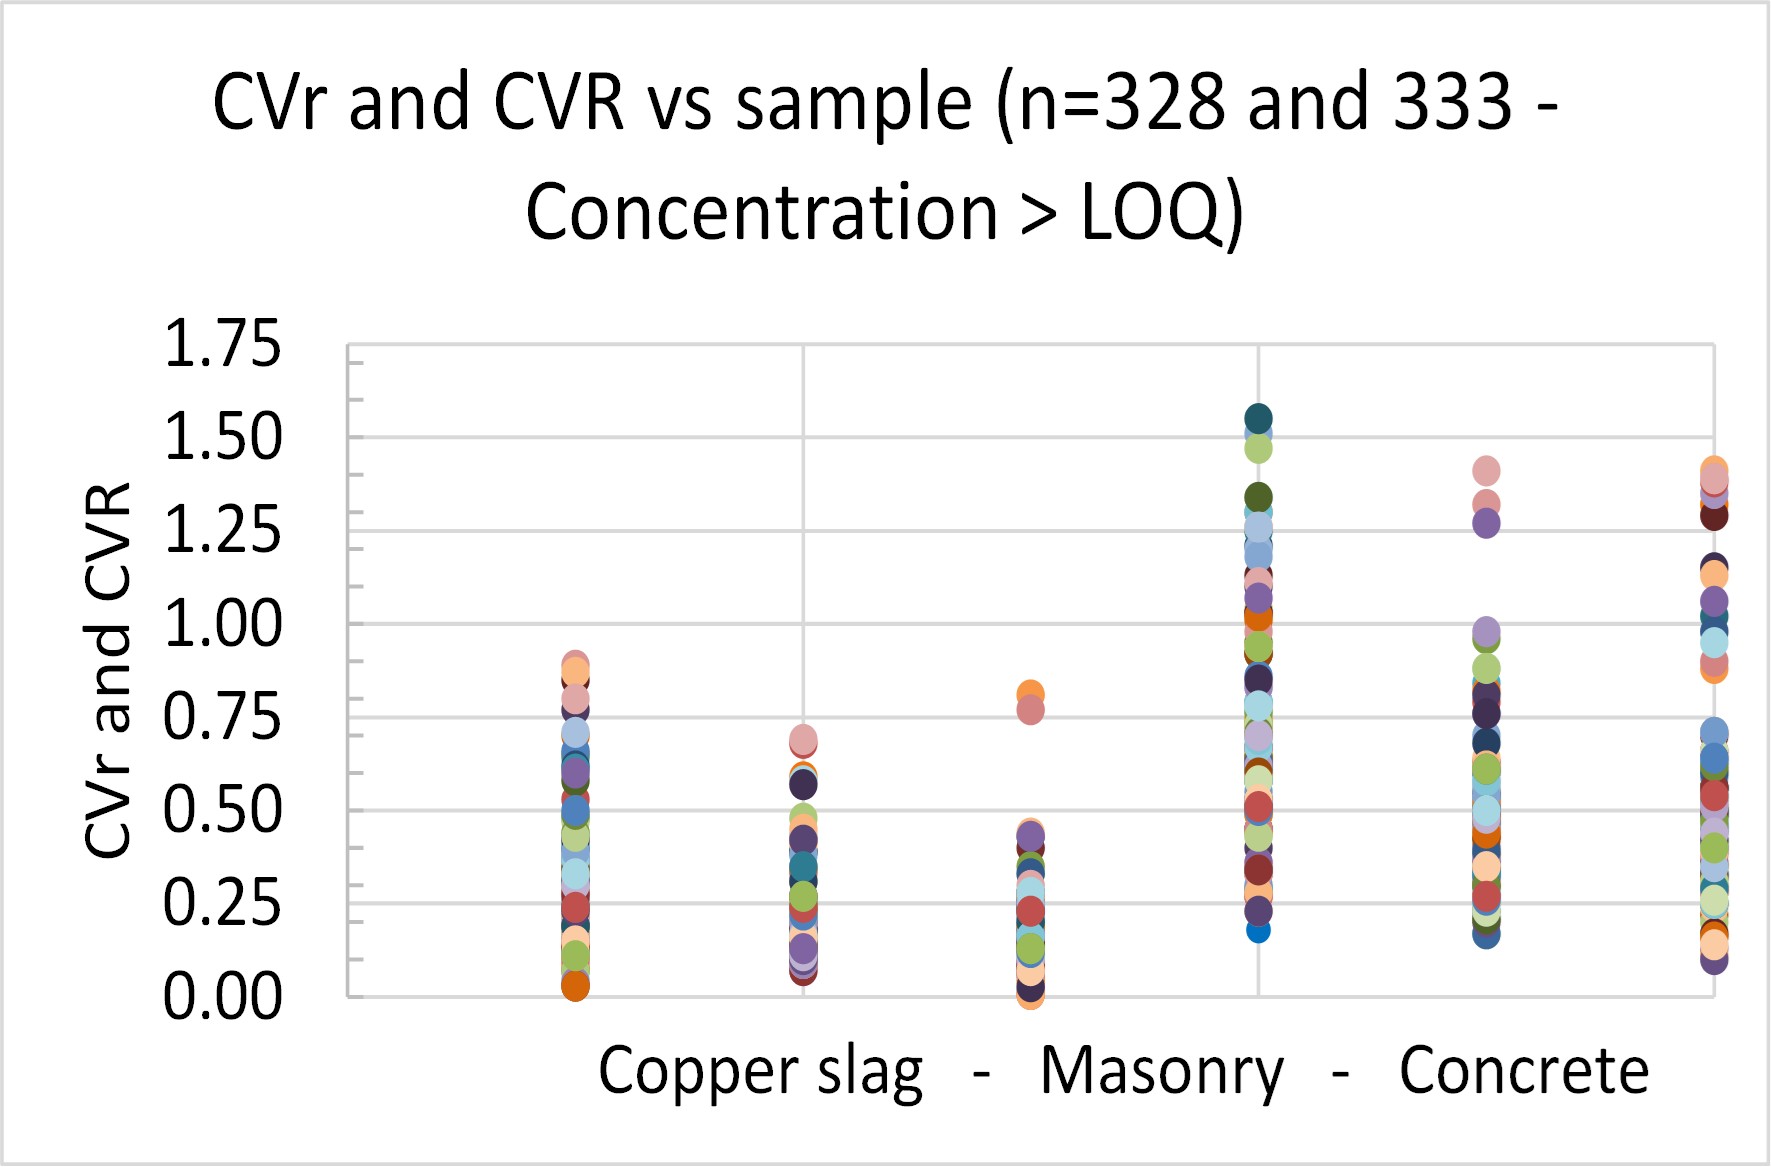
Fig4e

Fig4a
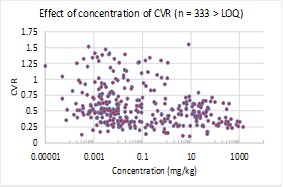
Fig4b
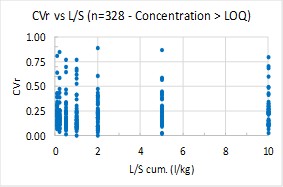
Fig4c
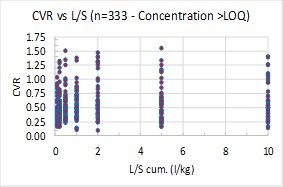
Fig4d

Fig4e
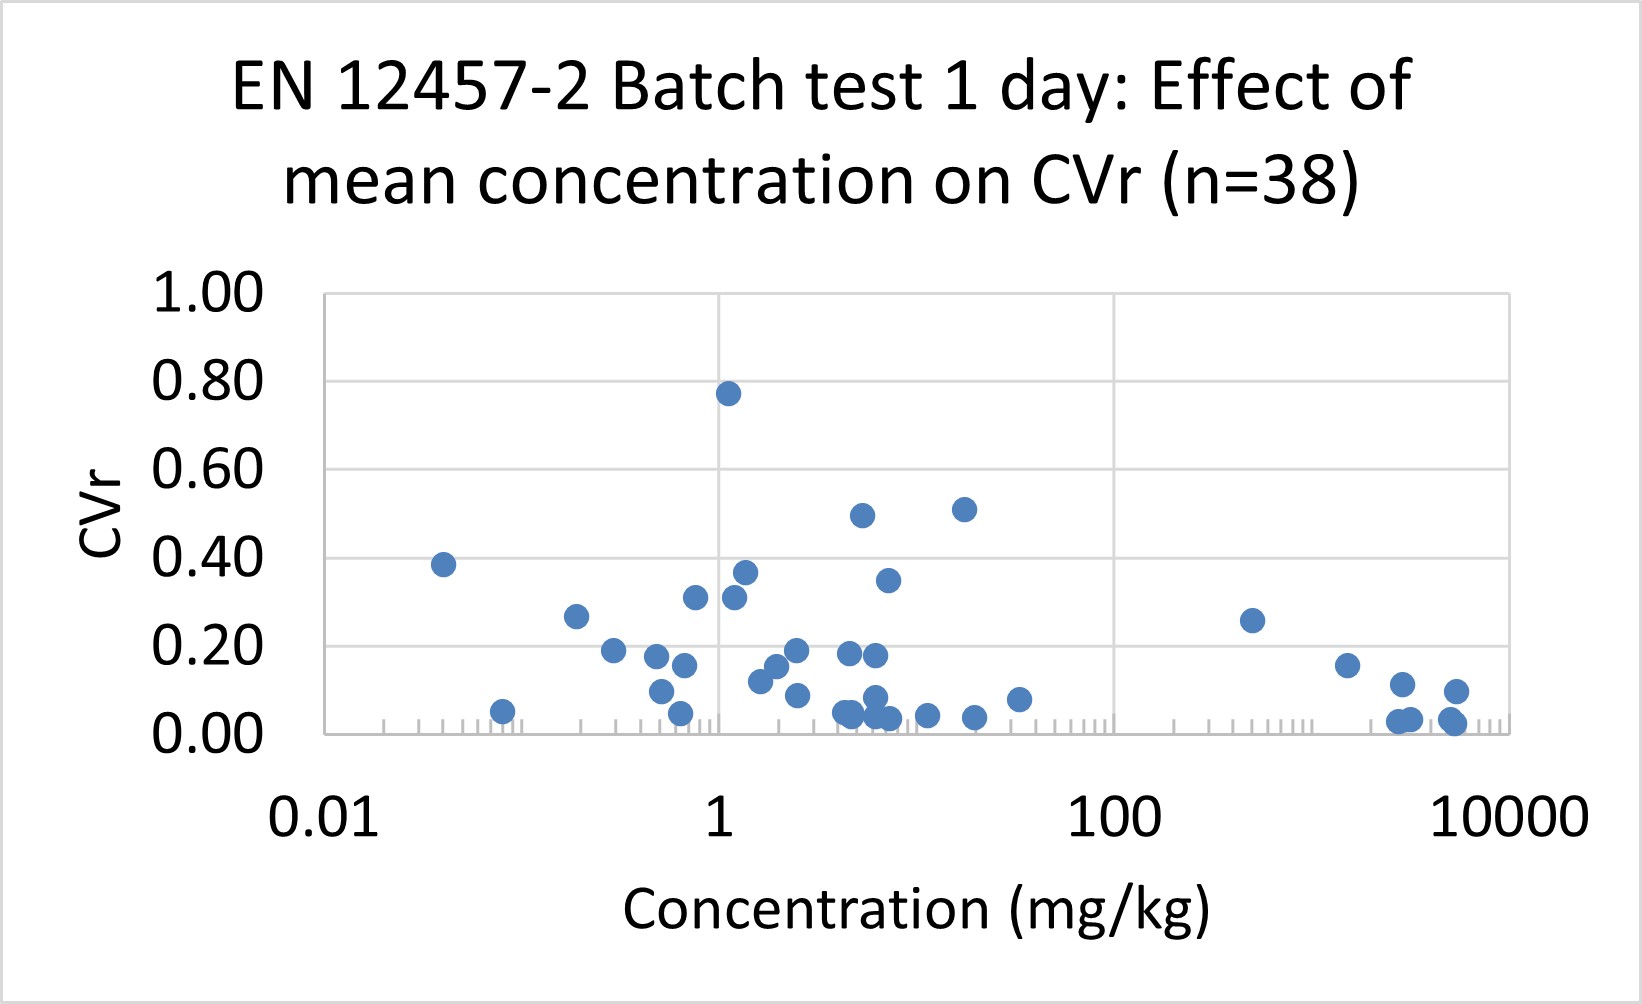
FIg2a EN 12457
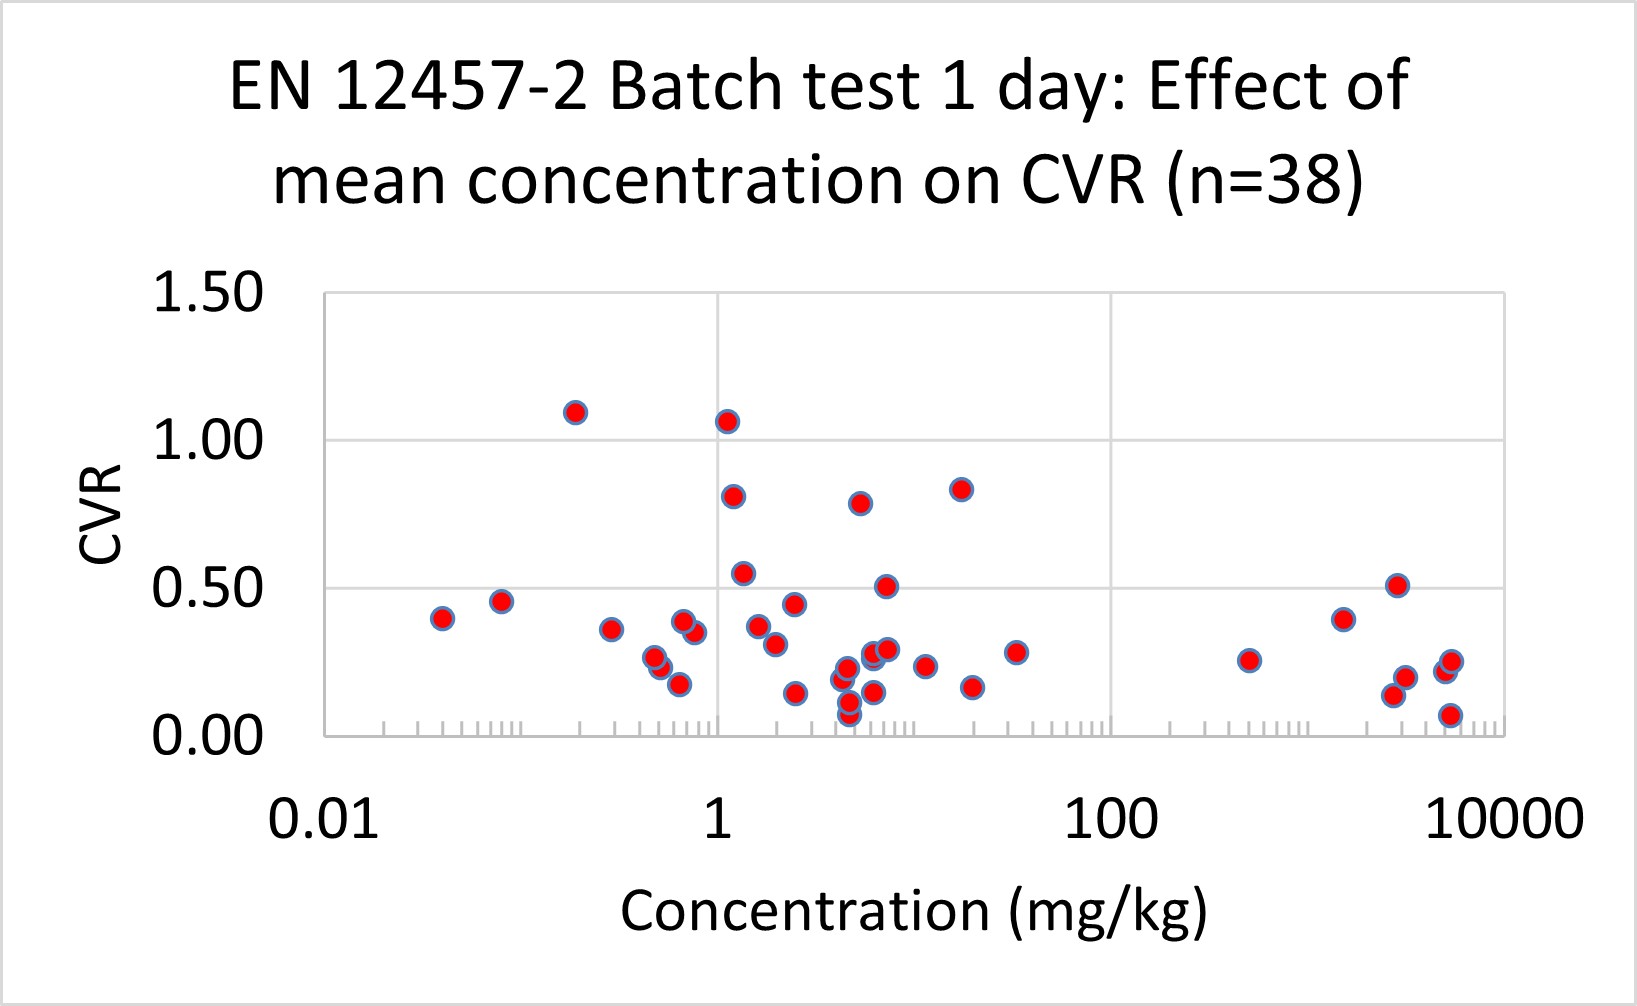
Fig2b EN12457-2 CVR
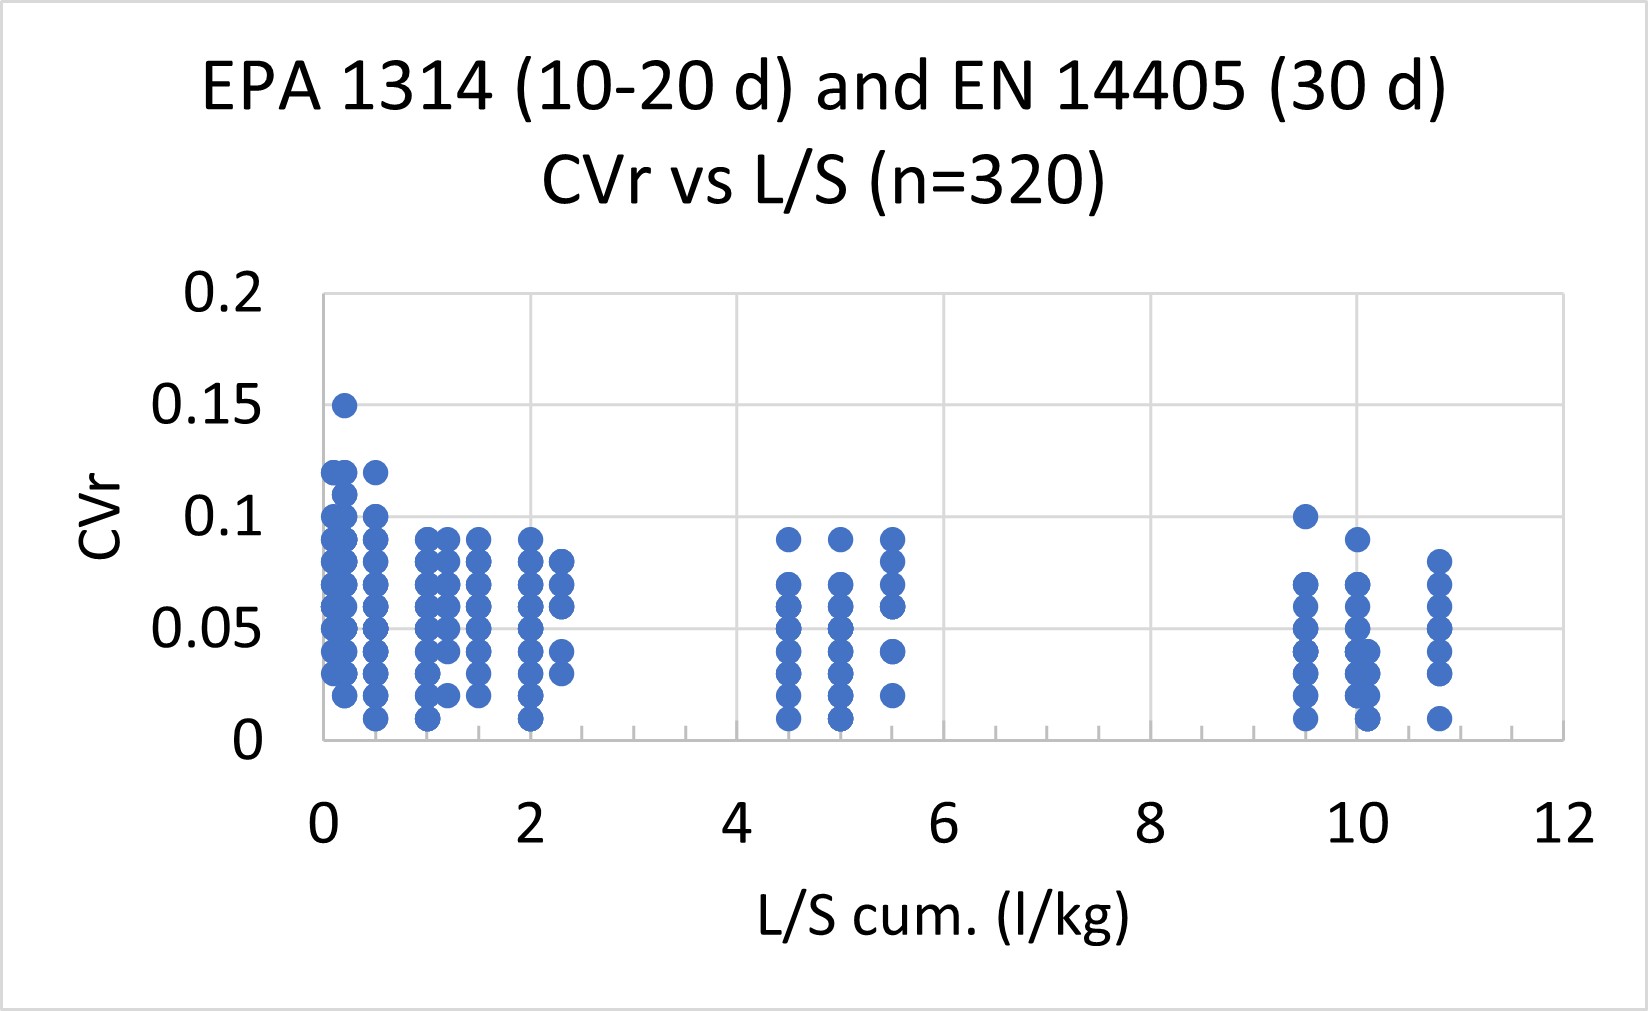
FIg3c 24 h column test
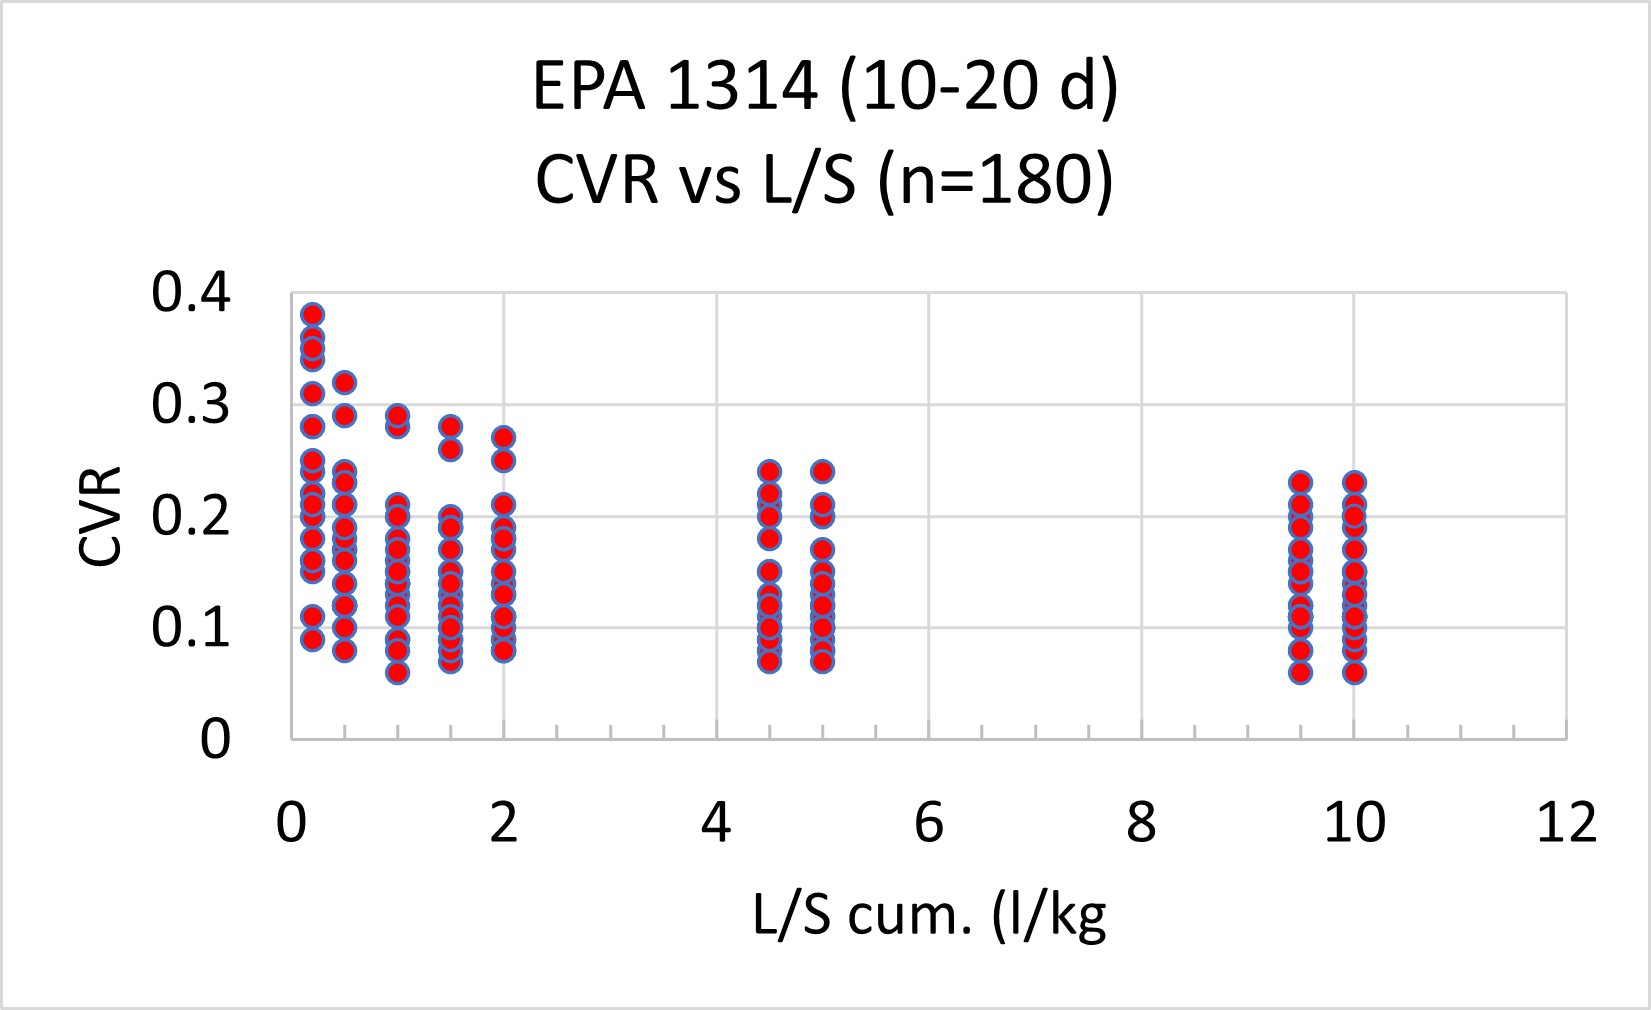
FIg3d 24 h column test
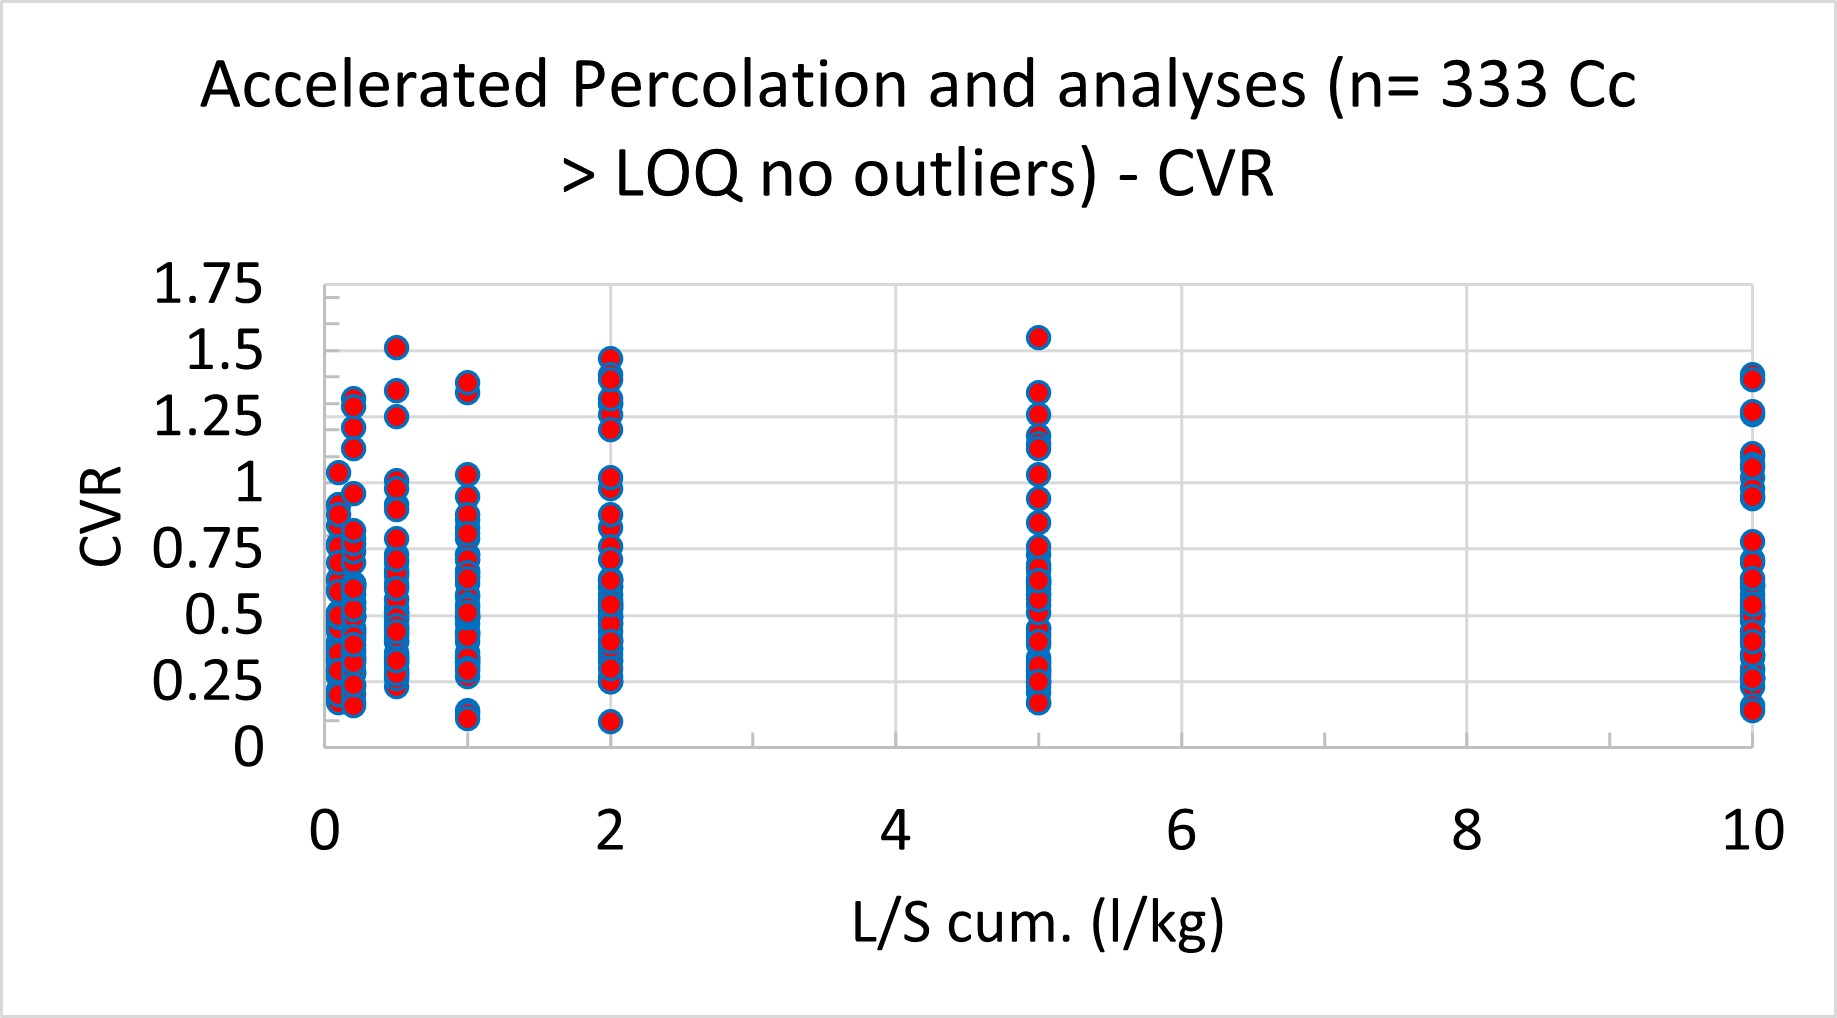
Fig4d
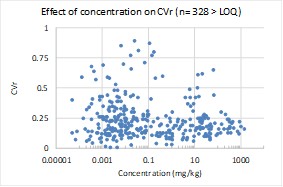
Fig4a
Variability of accelerated percolation test EN16637-3